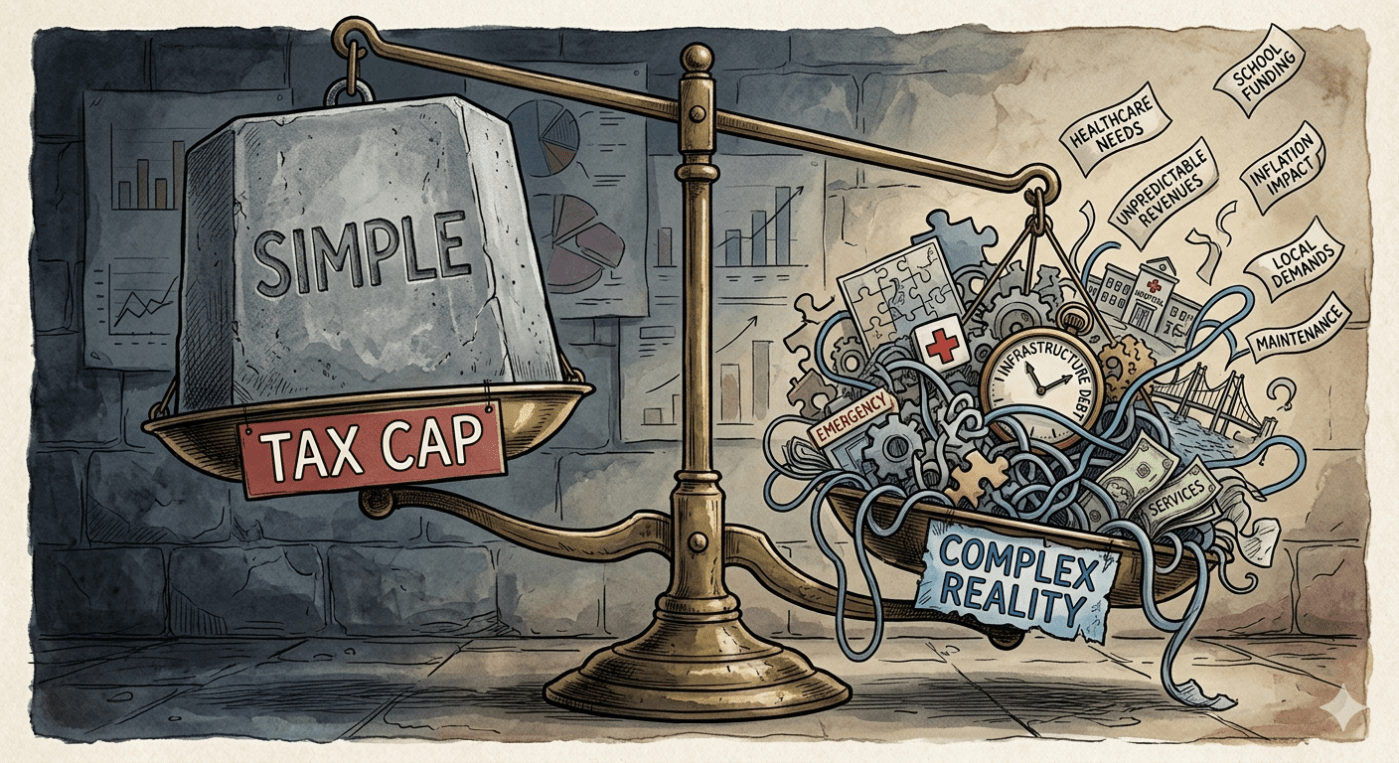
Some policies sound responsible because they’re simple—until you look at what they leave out.
A proposal to cap local property tax revenue growth using an inflation plus population growth formula is gaining traction in the North Carolina General Assembly. Framed as a neutral, data-driven safeguard against supposed “reckless spending” by county leaders, the idea is being promoted as common sense fiscal discipline.
It isn’t.
A report assembled by the John Locke Foundation has been circulating through legislative offices, encouraging lawmakers to adopt this formula as a ceiling on local government revenue. Despite its polished presentation, the report reflects a fundamental misunderstanding of basic economic principles and ignores clear historical precedent.
As someone who has applied a cumulative inflation plus population formula for over a decade, including research that underwent peer review for publication in the UCLA Law Review, I’m well-versed in sorting through and using data. And as a teacher guiding high school seniors through an Economics and Personal Finance class, I’m uniquely qualified to break down the information and empower others to understand.
The difference comes down to one critical distinction: a floor versus a ceiling.
Error 1: Inflation + Population Growth ≠ Revenue Ceiling
Supporters present this formula as a neutral way to determine how much revenue a local government should be allowed to collect. That framing is misleading.
The formula is not an objective cap—it is a policy choice disguised as math.
When used properly, inflation plus population growth can help estimate whether funding has kept pace with needs over time, and offer an incomplete minimum baseline for maintaining services.
For example, I’ve used this formula to demonstrate state education funding shortfalls over time. This includes showing how per-pupil funding has lagged behind what would have been required to simply maintain purchasing power.
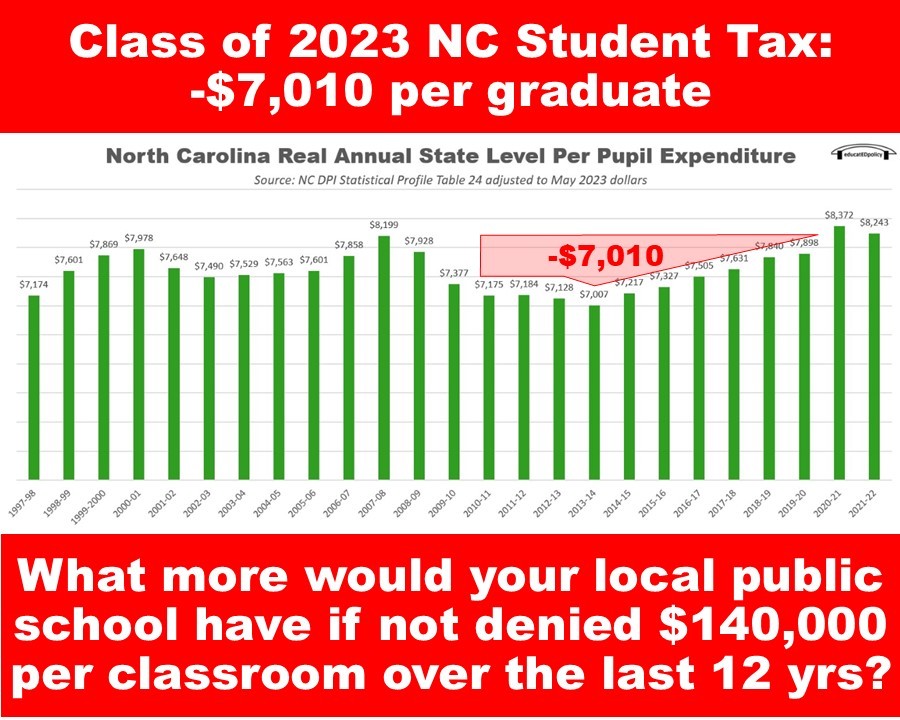
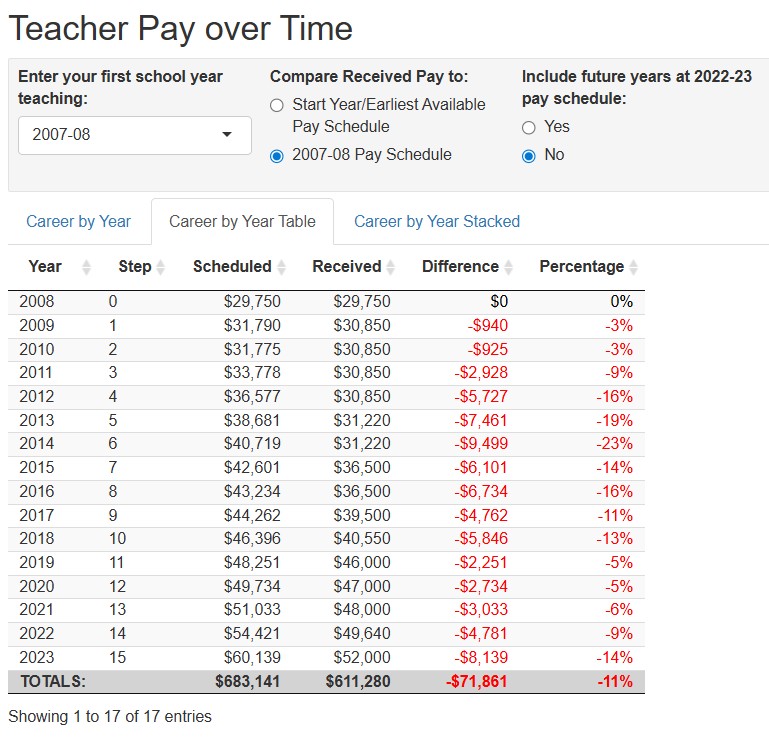
I also partnered with Derek Scott to launch the NC Teacher Tax website with a customizable calculator applying this formula to a range of teacher entry dates. Many have effectively lost more than a year’s worth of salary in lost wages compared to the purchasing strength of the salary schedule they “signed up for.”
As of 2023, my cumulative inflation-adjusted lost wages as a “floor” totaled $71,861, not including additional supplement losses attached to that base.
In both cases, the formula identifies a minimum threshold for evaluation, not a maximum limit for policy. And even that minimum is incomplete without accounting for other factors.
Using it as a ceiling is not neutral. It is austerity by design.
Error 2: Ignoring Increasing Marginal Cost
The proposal also ignores a foundational concept in economics: the increasing marginal cost principle of supply.
Supply is not linear—it’s a curve.
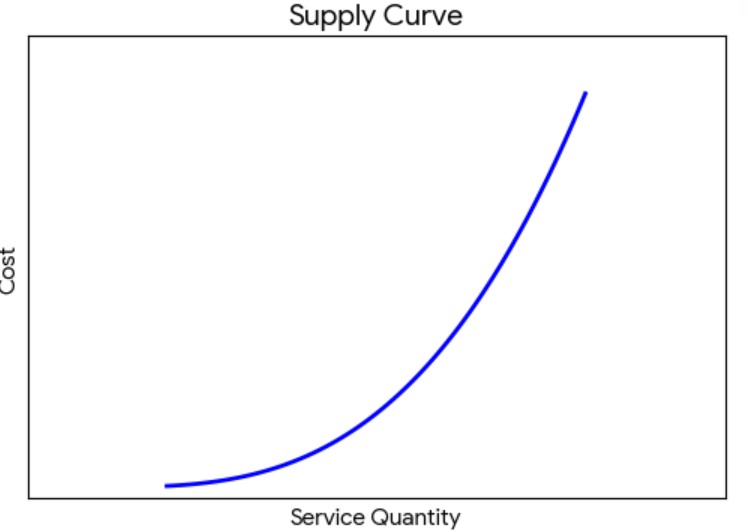
As output increases, the cost of producing additional units of service rises. That’s why the curve is more steep in the further right portion than the beginning bottom left. This concept is true regardless of the good or service provided.
Uniquely, public services are more likely supply inelastic compared to other goods and services. This means their marginal cost increase tends to be higher, and it requires much more input (revenue) to produce additional units of output (services).
In their analysis, the John Locke Foundation ignores these basic economic concepts and accuses county commissioners who recognize this reality of “reckless spending.” Unfortunately, the example below would qualify as “reckless.”

A growing community typically adds fire stations as new homes and buildings are erected. Local governments balance the marginal benefits (ex. response time) with the marginal costs (ex. new fire station, truck, more employees).
JLF’s inaccurate analysis implies the idea that the only cost difference between a fire station built in 2015 and one built in 2025 is inflation and population growth. That argument is economically indefensible.
It ignores the basic economic fact that producing goods and services (especially labor-intensive services such as firefighting) on a larger scale means there will be an increase in the marginal cost, even without factoring in population growth and inflation.
It also ignores the impact of the population distribution and types of buildings created (7 stories vs 3 stories), impacting the different and likely more expensive equipment required to properly fight fires in a growing community.
This also wouldn’t factor in the higher cost of property for the station itself, which its own report has shown to outpace inflation in communities experiencing population growth.
Neglecting these variables and economic principles in a fiscal policy analysis indicates either a lack of understanding or deliberately ignoring these factors. Either way, making local budget decisions based on such a faulty analysis would leave a community with longer response times, and potential competition with neighbors for access to first responders as they triage emergencies instead of confidently serve each emergency.
Error 3: Misapplying Consumer Inflation to Government Costs
The proposal’s tax ceiling relies on inflation as measured by the Consumer Price Index (CPI). That’s a problem.
CPI reflects a household “market basket” that includes goods and services like toys, haircuts, clothing, and groceries.
Local governments don’t operate like households. Their main expenditures include education, public safety, health services, and infrastructure. These sectors have consistently experienced cost growth above CPI.
Using CPI as a proxy for government cost growth systematically underestimates actual spending needs. This reality further reinforces why this formula should be treated as a floor, not a ceiling.
Exaggerations That Don’t Hold Up
The report also relies on rhetorical overreach in its exaggerated description of the revenue gap and overstating effects in urban counties while failing to publish any similar analysis for rural counties.
Using state property tax data, the graph below depicts information similar to the JLF report. It shows the difference between actual property tax revenue increases, and a historically applied revenue tax cap.
The difference is 4%
Proponents of the tax cap policy claim this is a sign of excess. Remember they inaccurately view the tax cap as a ceiling.
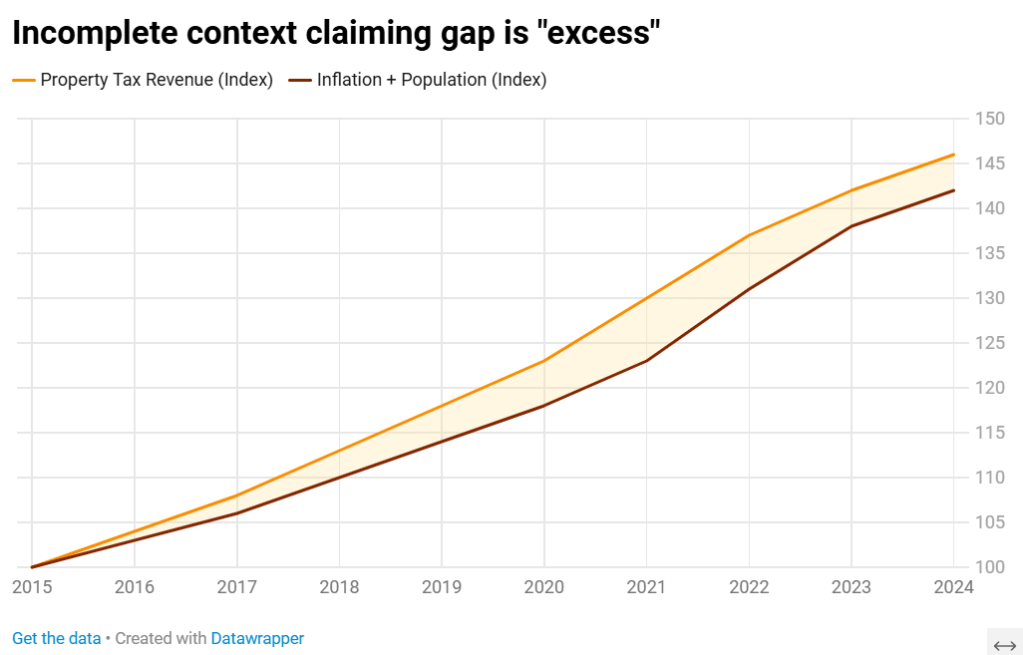
When using the formula as a floor, the 4% difference can easily be accounted for by incorporating variables and economic principles ignored by a limited inflation plus population growth formula. The report purports to call out “reckless spending” but actually proves financial discipline, and in some cases, funding shortfalls.
The entire JLF report targets the state’s ten largest counties.
In reality, the tax cap policy may hit rural counties harder. Urban counties often have larger sales tax bases and more diversified revenue streams. Yet rural counties rely more heavily on property taxes. Limiting that revenue source leaves fewer alternatives which can force service cuts or increased reliance on regressive sales taxes.
That contradiction is hard to ignore. Advocates claim to protect low-income residents while promoting policies that shift costs onto them.
Missing Context: State Policy Created the Pressure
Over the past decade, the North Carolina General Assembly has reduced income tax rates and is phasing out the corporate income tax entirely.
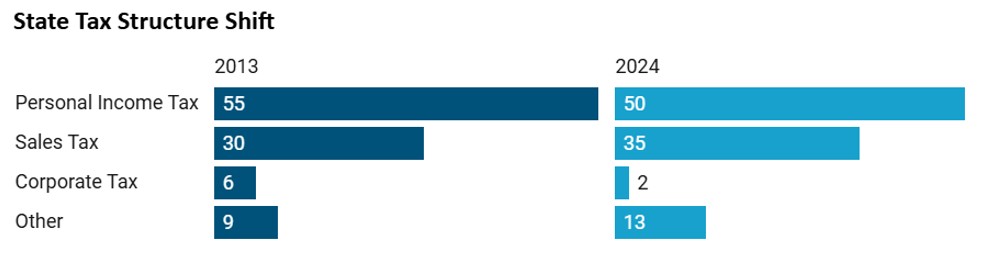
This has:
- Constrained state revenue
- Shifted funding responsibility to local governments
- Increased reliance on property taxes
This policy choice has been an adjacent case study in capping potential revenue. Those who teach, protect and serve throughout the state have testified to the damage to state services by underfunding them. This impact is validated by poor recruitment and retention rates among educators and state employees, as well as high vacancy rates. State residents showing up to the DMV or hearing about the mid-year departure of their child’s classroom teacher also feel this impact.
Local officials didn’t create this imbalance—they’re managing it. Now, the same policymakers who reduced state capacity are proposing limits on local governments’ ability to respond.
Missing Context: Colorado Already Tried This
North Carolina legislators are pitching Colorado’s misguided experiment with an inflation plus population growth cap, which passed in 1992. One key difference is Colorado’s state legislature imposed this cap on its own source of revenue, whereas proponents in the NC General Assembly advocate for imposing this standard on local governments across the state.
Supporters frame this as innovation and discipline. It isn’t.
Within 12 years of Colorado’s experiment with this formula as a state ceiling, education funding plummeted to among the lowest in the country. Health services and access were also slashed, harming access to health care for vulnerable populations.
Within little more than a decade, voters approved changes (Referendum C) to loosen the restrictions.
That’s not a success story—it’s a warning.
North Carolina is already starting from a weaker position. We are last in the nation in education funding effort, and millions of North Carolinians await a solution to the $319 million Medicaid funding gap to preserve access to health care.
Importing a policy that strained a stronger system is a risky proposition. Perhaps state legislative leaders should get their own fiscal house in order before trying to tell county commissioners how to manage their budgets.
The Bottom Line
A formula can guide decisions—but it should never replace them.
An inflation plus population growth formula can be a useful analytical tool as a financial floor. However, turning it into a revenue ceiling ignores how costs actually grow, how services are delivered and how economies fluctuate.
This isn’t neutral policy. It’s a deliberate constraint with predictable consequences. If lawmakers want to pursue fiscal discipline, they should start by aligning revenue systems with real-world costs—not impose formulas that ignore them.


Leave a comment