
In this post I’ll use primary sources with my own pragmatic translations to help folks understand how student growth is currently measured. It’s not a secret recipe – it’s a published formula.
This isn’t a “sour grapes” post. When I was evaluated by EVAAS for multiple years of my teaching career, my students “exceeded expected growth” both in middle and high school social studies when we had state testing for those subjects.
Just because I “won” doesn’t mean I don’t see through the immense losses the formula creates with misleading narratives about student, teacher, and school growth and achievement. There’s a key conflict between what is “statistically sound” vs “pragmatically accurate.”
So far the statisticians have been winning the debate with deference to a methodology that dismisses pragmatics. It fosters a false narrative that kids aren’t learning.
The key question is simple: Should growth be measured by how much faster a student runs, or by whether they pass someone else on the track?
Math with Mickey
To get you up to speed with the foundation of this rank-gain formula, let’s pretend 5 Mickeys from “Steamboat Willie” race each other in a 100-yard dash. After the first race they finish in this order with these times:

While any of these finish times could be respectable for a student, a fixation on “place” would label our fifth-place student as a bad performance simply because that student finished last. Any additional context around that “last place” finish would be dismissed.
That would be like telling a student who earned a “C” that they’re not good enough because other students scored better.
Let’s assume the Mickeys race a second time and they finish in this order with these times:

In the second race, each student improves their finish time – they all grew in speed!
However, EVAAS growth conclusions are based on rank change, not speed.

If you guessed Blue Mickey – you’re right.
Because Blue Mickey finished in second place which is an improvement on his first race’s 3rd place finish, this system would credit Blue Mickey with the highest growth score. He exceeded his “expected” growth by beating his previous 3rd place finish.
Based on a rank-gain system, which Mickey would receive a negative growth score? Look at the race results again:
Race 1

Race 2

If you guessed Green Mickey – you’re right.
Under this system, it doesn’t matter if Green Mickey ran 5% faster in his second race compared to his first race. What matters is that Green Mickey finished in 3rd place when he was projected to finish in 2nd place based on past performance. By that standard, Green Mickey lost growth despite running almost 1 second faster.
As for the other 3 Mickeys, they would be labeled with a growth score of 0 because they finished both races in the same places. It wouldn’t matter that all 3 of them finished the second race faster because the growth formula focuses on the place one finishes, not the time.
EVAAS documents clarify that a growth score of 0 doesn’t actually mean a student didn’t gain more knowledge, however this detail gets lost in translation among policymakers who assume it means those kids labeled “0 growth” aren’t learning much.
When many students show improvement, it should be celebrated. If all students show growth, they should have an opportunity to be acknowledged as growing.
That’s not how EVAAS works.
In their own words
The Mickey example is simplified, but the underlying logic isn’t. EVAAS documentation explicitly defines growth in terms of changes in relative standing among peers. Let’s look at the language directly from the source materials.
1. Percentile change as measurement of growth achievement
Notice the “achievement level” labels are based only on how a student changes their percentile rank compared to peers, just like the finishing ranks of the racing Mickeys.
Student Growth Percentiles (SGP) is the methodology behind how “growth” is currently evaluated in North Carolina. Under this system, students are deemed to have grown academically ONLY if they outperform their expected percentile finish. Here’s a summary from a NC State Board of Education slide deck:
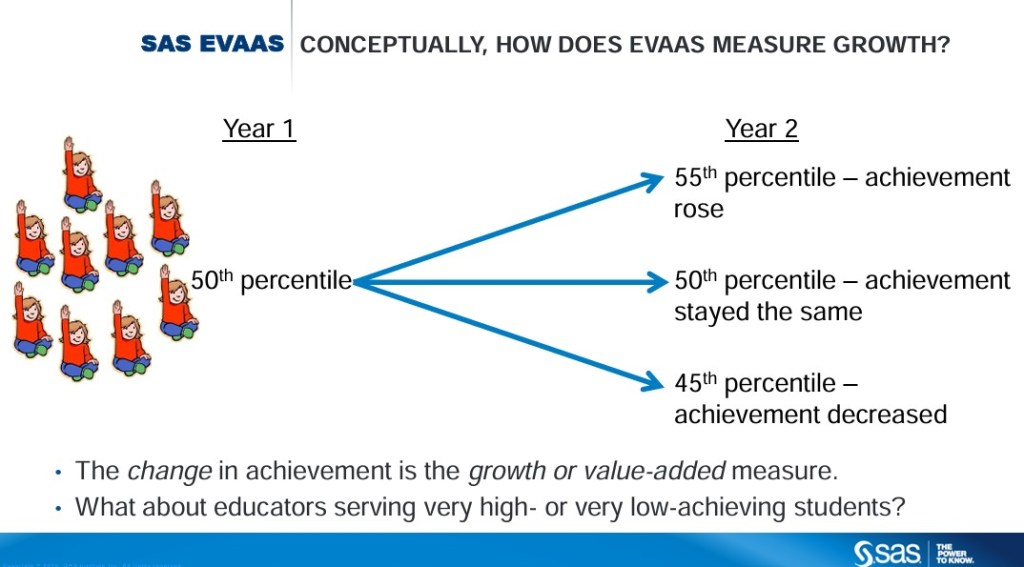
A percentile rank describes how a score compares to another score. Imagine there are 100 students who all take a test and are then lined up from lowest to highest score. A student in the 75th percentile is deemed to have scored better than 74 others in the line of 100 students. A similar (though not perfect) way of thinking of this would be to think of the student as coming in 26th place.
The percentile rank is not the same as a percentage correct, nor is it an indicator of it. While we can infer which Mickeys were faster than others based on the order they crossed the finish line (percentile rank), the place they finished doesn’t tell us anything about whether their times were fast or slow (percentage correct).
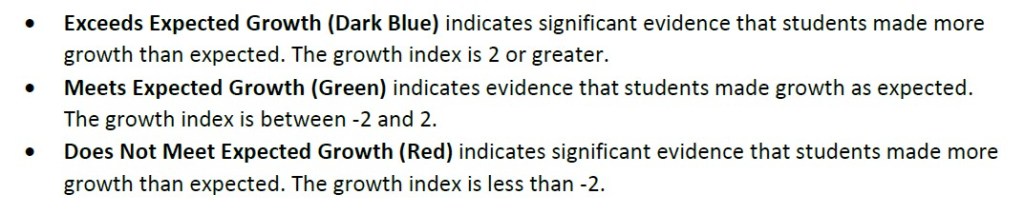
2. Growth labels as pragmatic misnomers
EVAAS defines academic “growth” as outperforming one’s previous performance rank. This is different from how the average person would define academic growth: learning more.
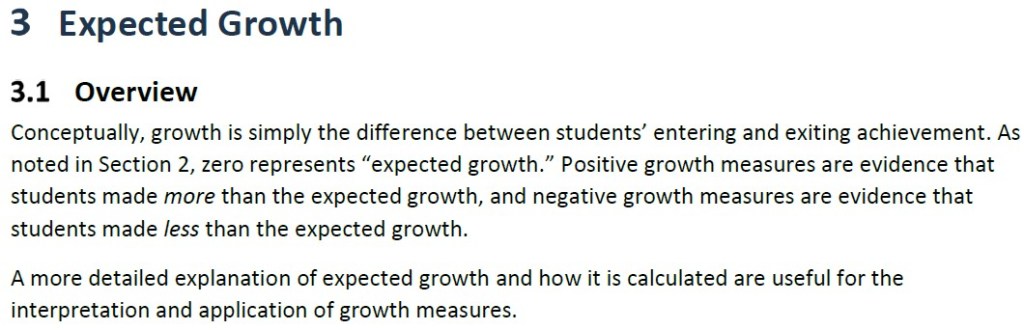
For example, they define 0 as: “zero represents expected growth.” This is different from layman’s terms understanding that 0 = no additional learning. While this is statistically defensible, it requires context to be pragmatically understood. That context is rarely robust enough to prevent using this data to build false narratives about student learning growth.
It’s possible that the student ranked in the 75th percentile answered questions with 50% accuracy, or 90% accuracy. Percentile only communicates how a student “finished” compared to others, NOT whether or not that student learned more, less, or the same based on demonstrated knowledge of subject matter.
The word “expected” often gets dropped in pragmatic conversations and becomes an oversimplified 0 growth, positive growth, or negative growth. While statisticians may argue that the burden is on others to properly communicate their technical definitions of “growth,” I would argue that the burden is on the statisticians to ensure their chosen labels align with pragmatic understanding of commonplace words. This disconnect fosters false narratives about student learning.
3. A zero-sum game some will ALWAYS lose

A key issue with EVAAS lies in the fact that it is not designed to offer the opportunity for all students to receive a positive growth score. It pits students against each other so that in order for a student to receive a positive growth score, they must either run faster than their peers or hope a peer trips along the way. It’s a Hunger Games mentality not just for students, but also for teachers.
Listen to the admission by a NC Department of Public Instruction official that EVAAS stacks the deck against growth performance evaluation with a zero-sum premise:
“EVAAS is problematic even for teachers who have it because in any given year, no matter how much our teachers grow, there will be a certain number of them who aren’t meeting expectations in that year…because it’s always based on that average in that year and there will be a certain percentage of teachers that will always be (labeled) ‘Not Meeting Expected Growth’ in that year.”
In summary: No matter how good teachers are, some will always be labeled not good enough by design.
Using percentile ranks as the basis of growth metrics imposes this zero-sum approach where only some can “win” if others “lose,” even if everyone improves.
While Mr. Tomberlin uses the word “teachers” in the quote above, the same statement is true if you were to replace “teachers” with “students” or “schools” because it’s the same system layered upon itself to generate labels for each group.
A formula that gives a negative growth score to a student who ran faster in their second race but was passed by more students before the finish line is not a pragmatic portrayal of negative growth.
A formula that gives a positive growth score to a student who ran slower in their second race, but ranks better because other students tripped on their way to the finish line is not a pragmatic portrayal of positive growth.
A formula that gives gives a growth score of 0 to a student who performed better academically but is hidden if everyone also performs better, is not an objective portrayal of growth. It’s a policy choice.
Next steps
If North Carolina wants to measure student growth, then we should start by agreeing on what growth means. Is growth learning more than you knew yesterday? Or is it simply outranking someone else today? Those are not the same thing, and our accountability system shouldn’t pretend they are.
1. NC State Board of Education Task Force on Accountability for Public Schools
Full disclosure: I am on this task force. This group is working to redesign how schools in North Carolina are evaluated in terms of inputs, metrics, and overarching conclusions about school performance. This is an opportunity to ensure our evaluation systems more accurately reflect the performances of students, teachers, schools, and districts.
You can learn more about the task force and its members here. I encourage you to reach out as we shape a new, and I hope better, accountability system.
You can find a history of recorded meetings here. The next meeting is June 18.
2. Parents
While we learn about our children’s test performances in terms of their “level,” scale score, and percentile, their growth score is not provided at all. Though it is currently used as the foundation for calculating teacher effectiveness and school performance, it is not transparent to us. Any growth measurement assigned to a student should be able to survive parent scrutiny to demonstrate confidence in the methodology’s reliability and its pragmatism.
3. Teachers
Both you and your students are more than a test score, particularly given current design features like EVAAS that are not intended to always give credit where it’s due. Remember a DPI official admitted: “no matter how much our teachers grow, there will be a certain number of them who aren’t meeting expectations in that year…because…a certain percentage of teachers that will always be (labeled) ‘Not Meeting Expected Growth’ in that year.”
Collaborate with colleagues to do what’s best for students. Don’t surrender to the Hunger Games environment that dangles bonuses for some teachers using flawed metrics.
Pushing back on these dynamics and helping others see through them is a way to “smile and change it” instead of “grin and bear it.”
4. Administrators
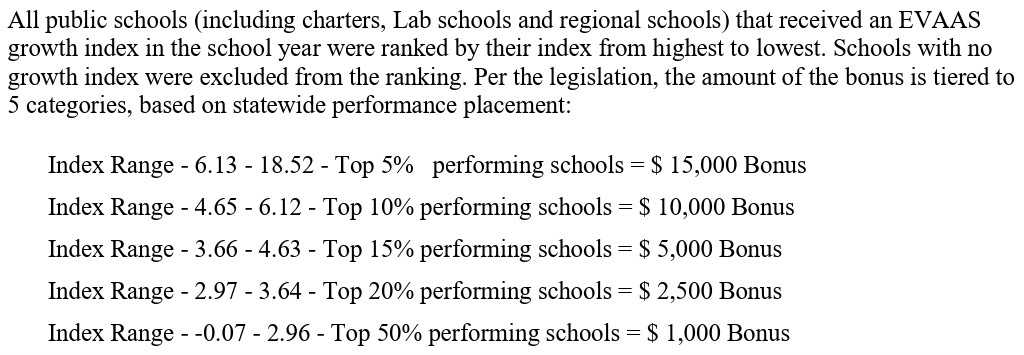
It’s imperative that more central offices and administrators join with teachers and parents in pushing back against these false narratives instead of playing the game since their bonuses depend on it (excerpts below). The deck is stacked against them as well since EVAAS treats success as a scarce resource.
Administrators can choose to protect students and staff from misleading narratives, or they can choose to selfishly play the game.
Remember: even if everyone runs faster, not everyone will receive a positive growth score. Supporting sincere student learning is a worthy cause. Encouraging the EVAAS hamster wheel is an exercise in futility that harms one’s leadership, staff collaboration, and student experience.
Conclusion
The debate over EVAAS isn’t really about statistics. It’s about language, transparency, and whether the labels attached to students, teachers, and schools accurately reflect reality.
If growth means learning, then our accountability systems should measure learning. If growth means ranking, then we should be honest enough to call it ranking.
Read the source documents linked throughout this post. Ask how “growth” is being defined. Challenge policymakers to explain the difference between improving knowledge and improving percentile rank.
The future of public education shouldn’t be built on misnomers. It should be built on measures that parents, teachers, students, and taxpayers can understand.

Leave a comment